We designed a speed controller for a real motor, the ABB Baldor-Reliance CDP3306 (¼ HP, 180 V, 1750 rpm), using only Python and its datasheet. The result settles a 1000 rpm step in 75 ms with no overshoot, a 76° phase margin, and a peak demand of 117 V from a 180 V drive.
Everything here uses open-source tools: python-control, NumPy, Matplotlib and pytest. The full script is built up section by section, and every number in the post comes from running it. This is the long-form companion to our Instagram carousel on the same build.
From datasheet to model parameters
Every model parameter traces back to a line in ABB’s customer information packet for the CDP3306. These are typical values, not guaranteed ones.
| Datasheet field | Datasheet value | Model parameter |
|---|---|---|
| Armature voltage | 180 V | Drive limit: 180 V |
| Base speed | 1750 rpm | 183 rad/s |
| Rated armature current | 1.25 A | — |
| Armature resistance | 8.54 Ω at 25 °C | R = 8.54 Ω |
| Armature inductance | 60.59 mH | L = 60.6 mH |
| Voltage constant | 98.01 V/krpm | K = 0.936 V·s/rad (= N·m/A) |
| Armature inertia | 4.68 lb·in² | J = 1.37×10⁻³ kg·m² |
| No-load point | 0.10 A at 1830 rpm | b = 4.88×10⁻⁴ N·m·s/rad |
Two values need a short derivation:
- K is both the back-EMF constant and the torque constant in SI units: 98.01 V/krpm ÷ 104.7 = 0.936.
- b isn’t on the datasheet, but the no-load point gives it: b = K · I₀ / ω₀.
One datasheet catch: the online catalog listing gives the inertia as 4.68 lb·ft². The performance data sheet labels the same number LI² (lb·in²). The lb·ft² reading would mean 0.197 kg·m², which is physically impossible for an 11 kg motor, so we use lb·in². Always sanity-check your data before you design.
The motor model
Armature voltage in, shaft speed out: the DC motor is a second-order transfer function.
In python-control, with the datasheet constants:
import control as ct
import matplotlib.pyplot as plt
import numpy as np

# 1. Define physical motor constants (ABB Baldor-Reliance CDP3306 datasheet)
J = 1.37e-3   # Rotor moment of inertia (kg.m^2), 4.68 lb.in^2
b = 4.88e-4   # Motor viscous friction constant (N.m.s), from the no-load point
K = 0.936     # Motor torque & back-emf constant (N.m/A or V/rad/s), 98.01 V/krpm
R = 8.54      # Armature resistance (Ohm), at 25 C
L = 60.6e-3   # Armature inductance (H)

# Open-Loop Motor Transfer Function: armature voltage (V) -> speed (rad/s)
num_motor = [K]
den_motor = [J * L, (J * R) + (b * L), (b * R) + (K**2)]
motor_sys = ct.TransferFunction(num_motor, den_motor)
Before designing anything, check the model against the data:
- No-load speed: at 180 V the model predicts 1828 rpm. The datasheet measured 1830 rpm.
- Under load: across all seven load points on the datasheet, from 0.10 A to 1.68 A, the model’s speed stays within 1.3%. It droops slightly less than the real motor, because R rises as the winding warms.
- Poles: a lightly damped pair at −70.6 ± 74.9j rad/s. The electrical and mechanical time constants (7.1 ms and 13.4 ms) are close enough to interact.
Validate against data before you tune a single gain.
Requirements first
Write the requirements down before tuning anything, each one measurable so it can become a test later.
| ID | Requirement | Target |
|---|---|---|
| REQ-01 | Overshoot | ≤ 5% |
| REQ-02 | Settling time (2% band) | ≤ 100 ms |
| REQ-03 | Steady-state error | 0 |
| REQ-04 | Phase margin | ≥ 60° |
| REQ-05 | Peak armature voltage for a 1000 rpm step | ≤ 180 V |
REQ-05 is the one most designs forget: the drive can’t supply more than 180 V, whatever the controller asks for.
The controller: PI on the error, D on the speed
The P and I terms act on the error, as usual. The D term acts only on the measured speed, so a step in the setpoint never passes through the derivative.
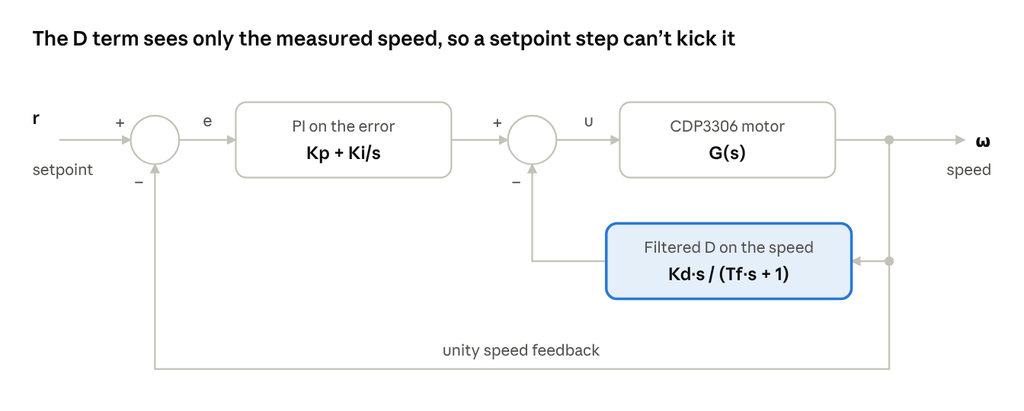
In code, PI sits in the forward path and the filtered D sits in an inner feedback loop around the motor:
# 2. Define PID Gains
Kp = 1.0     # Proportional Gain
Ki = 60.0    # Integral Gain
Kd = 0.002   # Derivative Gain
Tf = 0.002   # Derivative filter time constant (s)

# 3. Forward path controller (PI action on the error)
# C_pi(s) = Kp + Ki/s = (Kp*s + Ki) / s
C_pi = ct.TransferFunction([Kp, Ki], [1, 0])

# 4. Feedback path controller (filtered D action on the measured speed only)
# H_d(s) = Kd*s / (Tf*s + 1)
H_d = ct.TransferFunction([Kd, 0], [Tf, 1])

# 5. Connect the loop
# Inner loop: D feedback around the motor        -> P / (1 + P*H_d)
# Outer loop: PI on the error, unity feedback   -> C_pi*P / (1 + P*H_d + C_pi*P)
inner_loop = ct.feedback(motor_sys, H_d)
closed_loop_sys = ct.feedback(C_pi * inner_loop, 1)

# Armature voltage the controller asks for: u = C_pi*(r - y) - H_d*y
voltage_sys = ct.minreal(C_pi / (1 + motor_sys * H_d + C_pi * motor_sys), verbose=False)
The filter time constant Tf = 2 ms limits how much the derivative amplifies sensor noise. A pure derivative would multiply every measurement change by Kd divided by the sample time; at 1 ms that is a gain of 2 V per rad/s here, and far more with a larger Kd.
Closed-loop results
Simulate a 0 to 1000 rpm step, then read the metrics straight off step_info. Always plot the armature voltage too, not just the speed.
# 6. Simulate the response to a 1000 rpm step command
RPM = 60 / (2 * np.pi)
r = 1000 / RPM                                   # 104.7 rad/s
time = np.linspace(0, 0.2, 2001)
time, speed = ct.step_response(closed_loop_sys * r, T=time)
_, volts = ct.step_response(voltage_sys * r, T=time)

info = ct.step_info(closed_loop_sys, SettlingTimeThreshold=0.02)
gm, pm, wcg, wcp = ct.margin((C_pi + H_d) * motor_sys)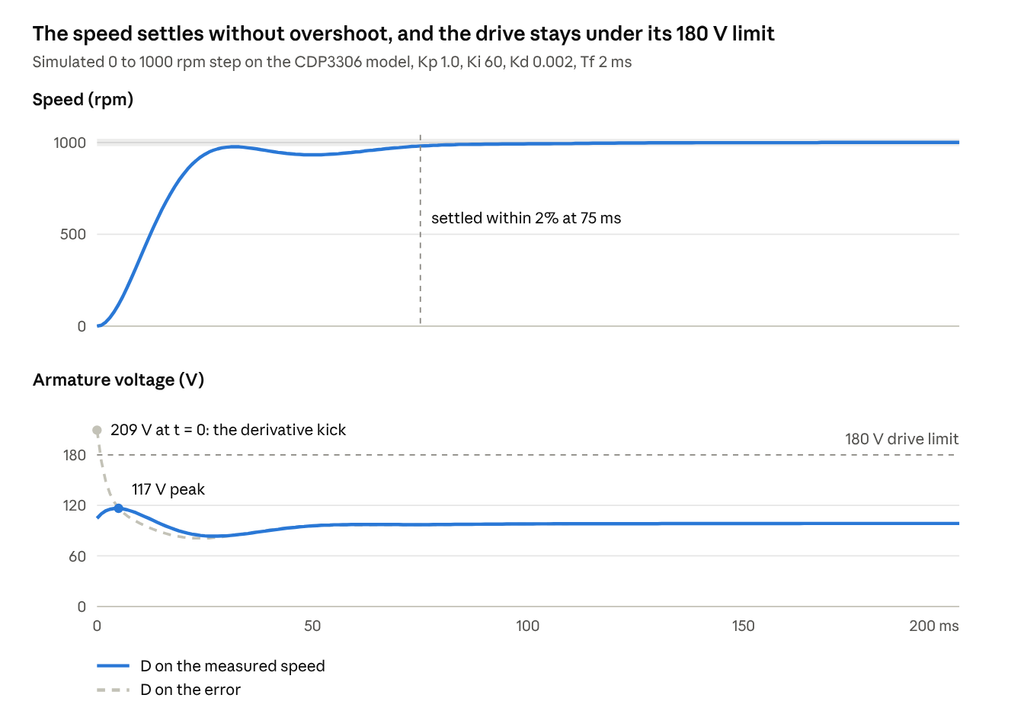
The speed rises in 19 ms, settles within 2% in 75 ms and never overshoots, so REQ-01, REQ-02 and REQ-03 pass. The voltage panel shows why the derivative sits on the speed. With the same gains applied to the error, the setpoint step asks for 209 V at t = 0, more than the drive can deliver. With D on the measured speed, the peak is 117 V and REQ-05 passes with margin.
Robustness and sample time
A good step response isn’t enough on its own, so check the loop’s margins too. The phase margin is 76° at a crossover of 89 rad/s, which passes REQ-04. The gain margin is infinite, because the phase never crosses −180°. Without the filtered D, the same PI gains give about 65°.
The controller will run on a microcontroller, so test it at the rate it will actually run. Discretize the controller with Tustin and the plant with a zero-order hold, which is how the processor sees it:
Ts = 0.001
motor_d = ct.c2d(motor_sys, Ts, 'zoh')     # plant as the MCU sees it
C_pi_d  = ct.c2d(C_pi, Ts, 'tustin')
H_d_d   = ct.c2d(H_d, Ts, 'tustin')
closed_d = ct.feedback(C_pi_d * ct.feedback(motor_d, H_d_d), 1)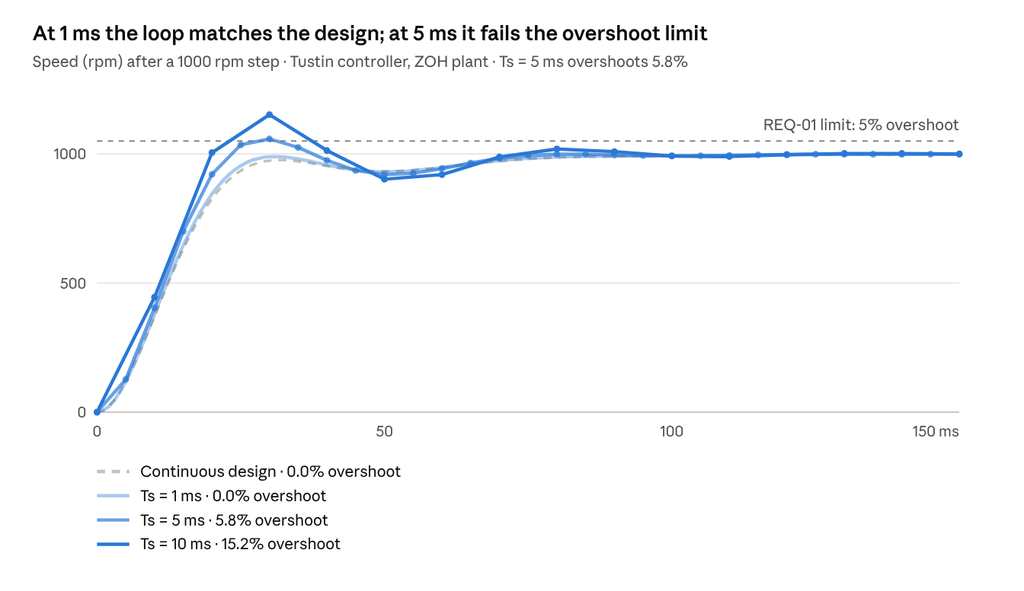
Sampling and the zero-order hold add roughly ωc·Ts/2 of phase lag. At 1 ms that is about 2.5° and the discrete loop matches the design. At 5 ms it is about 13°, enough to push overshoot past the 5% limit. The sample time is a design parameter, not an afterthought.
Requirements as tests
Each requirement becomes a pytest that imports the results from the script (saved as motor_pid.py):
# test_requirements.py
from motor_pid import info, pm, volts

def test_REQ_01_overshoot():
    assert info["Overshoot"] <= 5.0

def test_REQ_02_settling_time():
    assert info["SettlingTime"] <= 0.100

def test_REQ_03_steady_state_error():
    assert abs(info["SteadyStateValue"] - 1.0) < 1e-3

def test_REQ_04_phase_margin():
    assert pm >= 60.0

def test_REQ_05_voltage_limit():
    assert volts.max() <= 180.0
$ pytest -q
..... [100%]
5 passedRun this on every commit. If you change a gain or the sample time, the failing test tells you which requirement broke. That turns model-in-the-loop simulation into a regression suite for free.
Summary
| Step | Result |
|---|---|
| Datasheet to model | K, R, L, J and b, each traced to a datasheet line |
| Model validation | 1828 rpm predicted vs 1830 rpm measured |
| Controller | PI on the error (Kp 1.0, Ki 60), filtered D on the speed (Kd 0.002, Tf 2 ms) |
| Step response | 0% overshoot, 75 ms settling, 19 ms rise |
| Robustness | 76° phase margin, infinite gain margin |
| Actuator demand | 117 V peak, under the 180 V limit |
| Sample time | 1 ms, Tustin |
| Verification | 5 requirement tests, all passing |
These results use typical datasheet values. Next in the series, we read a Bode plot properly, then loop-shape this same motor. Later, we’ll identify the real motor from measured data and see how far the datasheet was off.
Have you ever caught a datasheet error that would have broken your design? Tell us in the comments, and follow Quadyne for the rest of the series.